View Executive Intelligence
See the hospital's revenue, collections, admissions and quality figures on one screen.
Executive Intelligence is a management dashboard. It brings the main figures for the hospital together so you can see how the week or month is going without opening each module.
Who can use this: management and department heads · Where: Home & Intelligence Dashboards › Executive Intelligence
Read the dashboard
-
Open Home & Intelligence Dashboards › Executive Intelligence.
-
At the top, choose the Facility Name and the Filter Type, for example This Week. The time next to As of shows when the figures were last refreshed.
-
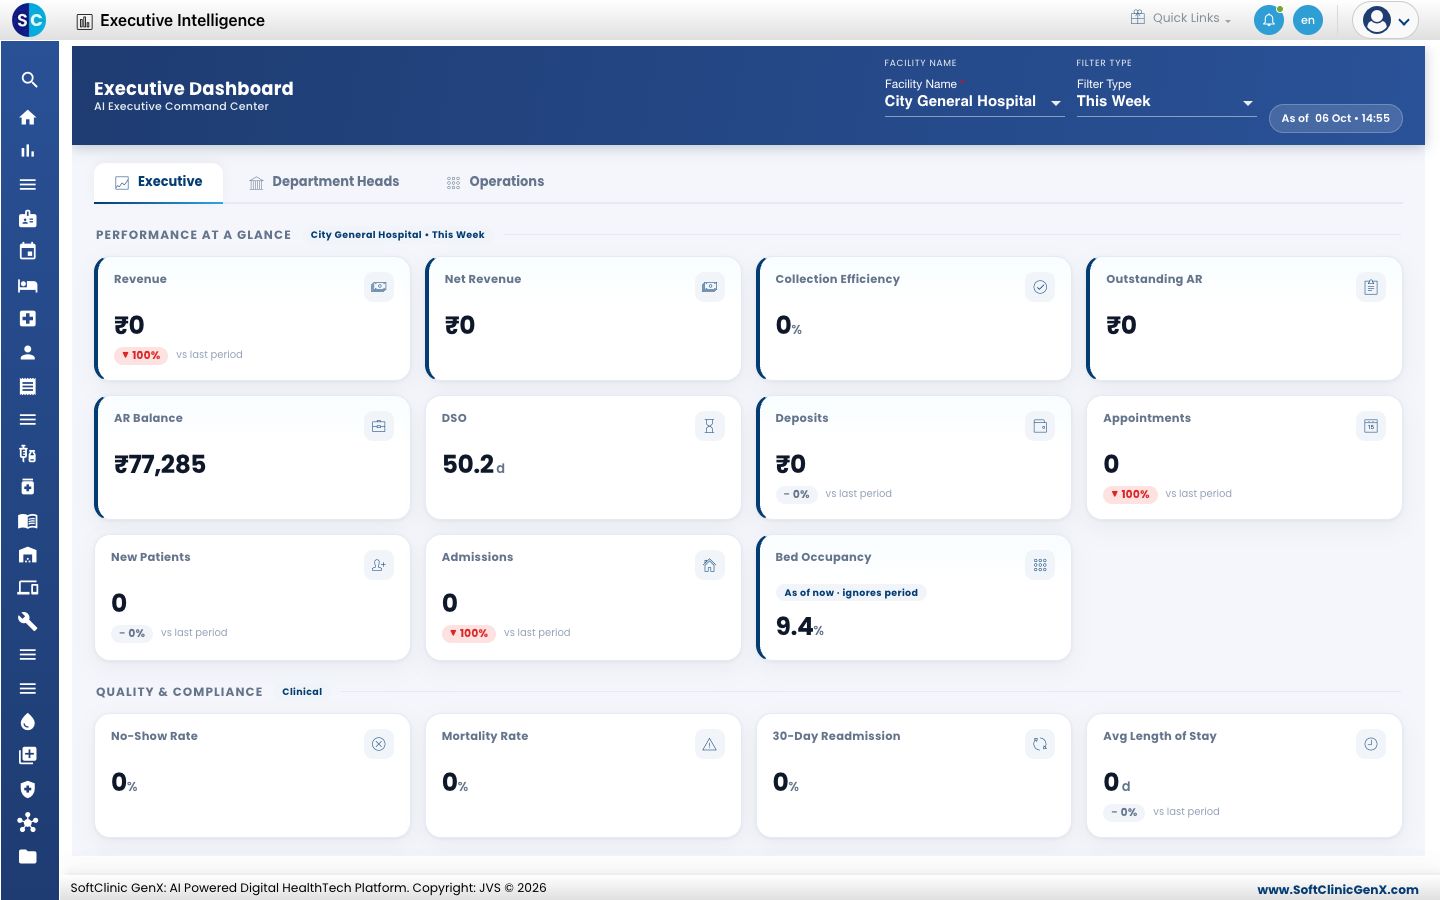
On the Executive tab, read Performance at a Glance: revenue, collection efficiency, outstanding amounts, appointments, new patients, admissions and bed occupancy. Below it, Quality & Compliance shows no-show rate, mortality rate, 30-day readmission and average length of stay.
-
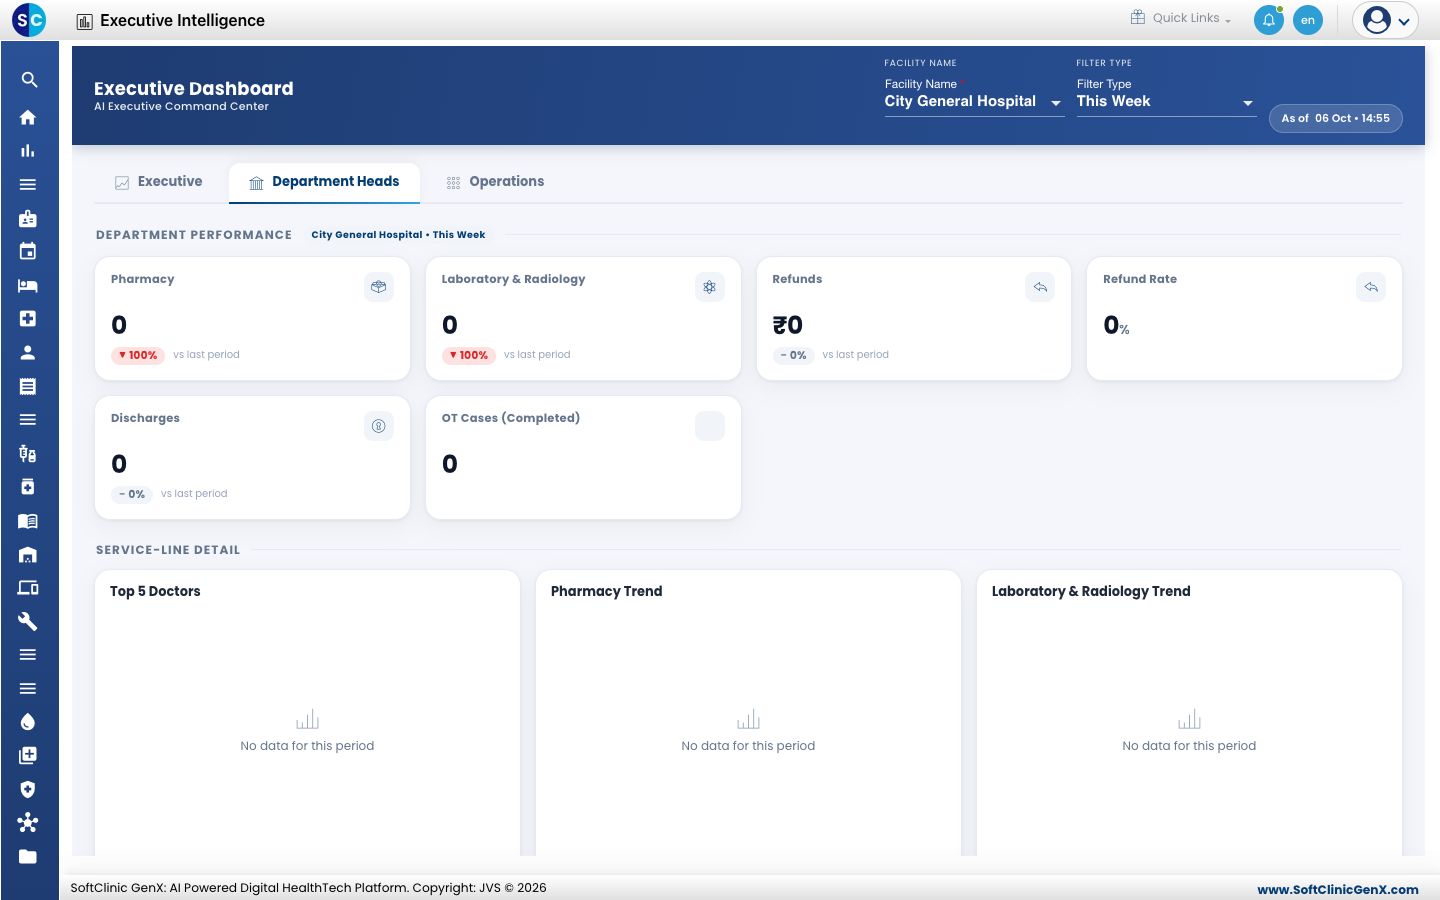
Click Department Heads to see how pharmacy, laboratory and radiology are doing, with refunds, discharges and operation theatre cases, and the top doctors and trends.
-
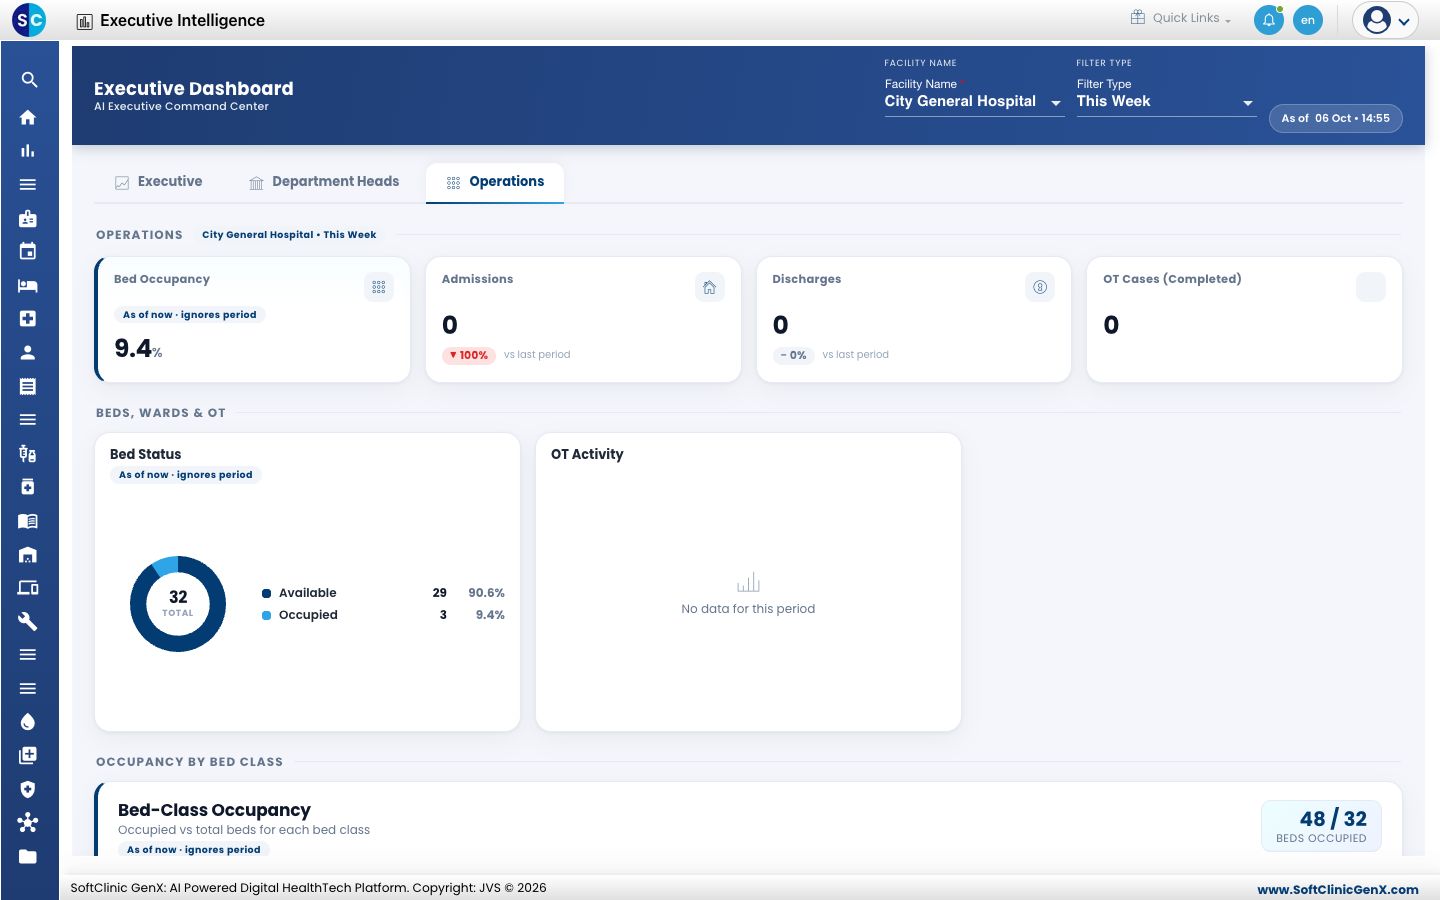
Click Operations to see admissions, discharges, bed status, operation theatre activity and occupancy by bed class.
Good to know
- Each tile compares with the last period, so a change in revenue or admissions shows as a percentage.
- Bed occupancy is a live figure as of now and does not change with the period you choose.
Related
- Find unbilled revenue: look into revenue that was never billed.
- Home & Dashboards FAQs: short answers about this dashboard.